December 07
11 min


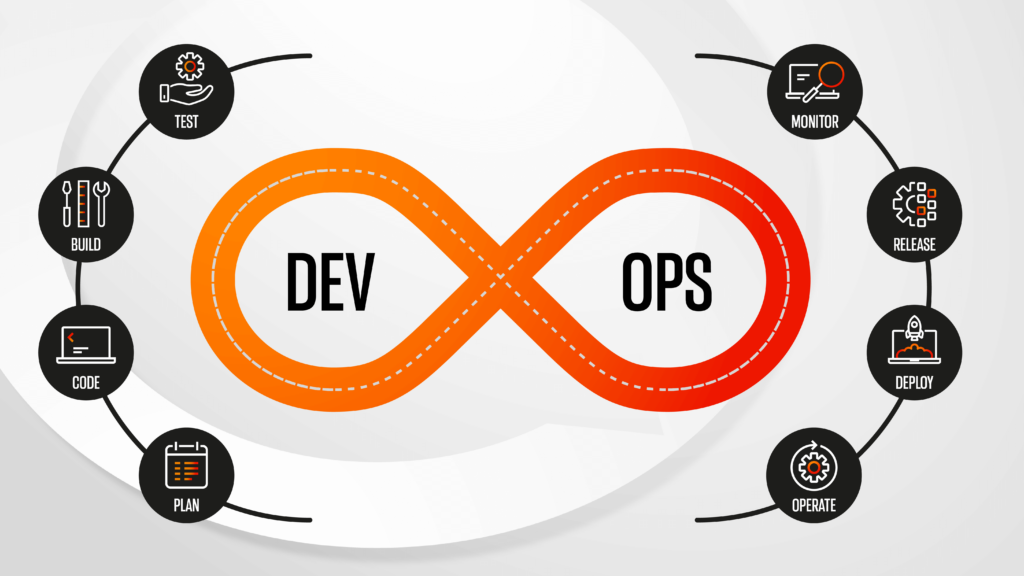
DevOps refers to the practices and culture that emphasize collaboration and communication between development(Dev) and operational (Ops)teams. Many organizations are adopting DevOps to streamline their software or IT production and delivery process, enabling faster and more reliable deployments.
Statistics reveal that nearly three-quarters (approximately 75%) of organizations have adopted DevOps in some form, a significant increase from 47% five years earlier. With this popularity, it has become more necessary than ever to keep track of your DevOps. DevOps monitoring is a great help as it allows you to detect, diagnose, and fix issues quickly.
This article is your ultimate guide to DevOps monitoring and its importance. You’ll also learn about the monitoring tools in DevOps and how they can help you. So, let’s begin.
Typically, DevOps monitoring refers to the practice of measuring the health and performance of various software and IT systems to find and fix issues quickly. Various DevOps monitoring tools help you in this by collecting data from various sources and providing key insights into the functionality of your software solutions via a user-friendly dashboard.
DevOps monitoring aims to ensure DevOps teams are working together to quickly deploy and update new software or applications. This results in less downtime and enhanced productivity.
Here are various points that further highlight the importance of DevOps monitoring:
DevOps monitoring helps the team quickly identify issues within the software delivery pipeline. It provides real-time insights into the performance and deployment of various solutions so the development and operations team can identify bottlenecks or failures. This translates to reduced downtime, ensuring efficient software performance, which is important for a good customer experience.
DevOps monitoring promotes collaboration among development, operational, and other cross-functional teams. How? It offers shared visibility into system performance and health metrics, so both teams are aware of the potential issues and align their efforts to resolve them.
In addition, it paves the way for open communication, and both stakeholders can work together when introducing new system updates or making improvements. As a result, you see an efficient system and less misunderstanding or fingerprinting.
DevOps monitoring is a great help in optimizing your available resources. You can utilize it to track key metrics such as CPU usage, memory consumption, and network traffic. This information helps you find over and under-utilized resources so you can make informed decisions about resource allocation and scaling.
When finding the best DevOps monitoring tools, you’ll come across different types, such as:
So, before discussing the top DevOps monitoring tools, let’s first learn the types of monitoring in DevOps in detail.
Infrastructure monitoring focuses on tracking and managing the health of your IT infrastructure, such as servers, networks, databases, and storage. It enables early detection of issues like high CPU usage and low disk space so you can take adequate steps to fix them. This ensures your IT infrastructure is running smoothly, minimizing downtime.
Application Monitoring tools, as the name suggests, refer to the tools that monitor and optimize the performance of software applications. They allow you to track various metrics like response times, error rates, and resource usage (CPU, memory) to identify bottlenecks and inefficient codes.
Using this data, the operations and software development teams can collaborate to improve application performance, significantly enhancing the end-user experience.
Best network monitoring tools observe the behavior and traffic of your organization’s network infrastructure. They help detect network outages, performance degradation, and security threats. Your DevOps teams can then use this information to improve bandwidth utilization and prevent network congestion.
Log Management Tools are used to collect, store, and analyze log files generated by various applications and systems. DevOps can leverage them to get information about the activities going on in an application and any issues with it. Moreover, a log management tool is incredible for conducting compliance and security audits.
Security monitoring tools work to detect and resolve security threats. You can use them to get information about any suspicious activities, unauthorized access attempts, malware infections, and data breaches to protect sensitive data in a timely manner.
Cloud monitoring tools are another type of DevOps monitoring tools that help you keep an eye on cloud resources and services like AWS, Azure, and Google Cloud. The purpose is to ensure all cloud-based applications work smoothly without any lagging issues.
DevOps monitoring tools allow you to automate and track a development process throughout the pipeline. Here’s a detailed explanation of each tool and its key features.
The first one on our list is Prometheus, which is an open-source technology that has features like monitoring and alerting functionalities for cloud-native environments. Its compatibility with Grafana and unique capabilities like time-series storage and data visualization make it a popular choice among DevOps professionals.
Not only this, but Prometheus has an exceptional alerting system that notifies you when it detects an issue.
Some key features of Prometheus are:
Logstash is a server-side data processing and transformation pipeline tool that takes data from multiple sources. This data is then sent to your favorite stash, like Elasticsearch, which most people use.
This DevOps monitoring solution has over 200 plugins and helps parse and forward log data.
Here are the key features of Logstash:
Grafana is an open-source analytics and data visualization web application that’s used to monitor the performance of software or applications. DevOps professionals can use it to collect and analyze data from different sources.
This information is presented in charts and graphs, and this panel architect helps DevOps teams identify bottlenecks. They can also receive alerts for any abnormal app behavior and take steps to resolve it.
Let’s look at some of Grafana’s key features:
Kibana is a leading DevOps monitoring tool, and professionals use it in conjunction with Elasticsearch. Its primary purpose is to explore and analyze vast organizational IT data from servers, networks, and log files.
There’s also an auto-highlighting feature in Kibana that makes it easy for you to pinpoint potential issues in your log files.
The standout features of Kibana are given as:
The next one on our list of top monitoring tools in DevOps is Elasticsearch. First introduced in 2020, this DevOps monitoring tool is an open-source platform developed on Java and the top Apache Lucene library.
This Java-based solution offers you quick, real-time searches, and to take the efficiency to the next level, Elasticsearch has recently introduced AI and Machine learning into the tool. You can use it to break down silos between DevOps teams and provide them with information about issues in the pipeline, improving overall decision-making.
Here are the key features of Elasticsearch:
Nagios is an open-source DevOps tool for continuous monitoring that runs on operating systems like Linux and Windows. It regularly checks various applications and networks to notify the DevOps team about their performance.
For instance, you can use DevOps to check memory consumption and disc usage. In addition, it monitors your compliance with various network protocols like Hypertext Transfer Protocol (HTTP), Simple Mail Transfer Protocol (SMTP), and Post Office Protocol 3.
The key features of Nagios are:
Splunk is one of the best monitoring tools in DevOps. It analyzes and collects information from log files of different applications. DevOps teams can use it to find issues in logs in real time and quickly resolve them. Furthermore, it allows you to optimize the performance of your IT infrastructure by identifying areas for improvement.
Splunk has key features such as:
Created by Alexei Vladyshev, Zabbix is a DevOps tool for continuous monitoring. It aids in checking the health of various parameters, such as networks, servers, and applications. You can use it to get information about network usage, CPU load, and system space consumption. Zabbix supports operating systems like Solaris, Mac OS, Linux, and Windows.
Here are Zabbix key features:
Librato is a complete DevOps monitoring solution that lets you gain visibility into your organization’s IT systems. It aggregates and transforms real-time data and provides analysis and alerts on all metrics.
The key features of Librato are given as:
Here comes our pick for DevOps cloud monitoring tools: Datadog. It helps organizations of all sizes track the performance of their logs, applications, and other data sources. What truly makes this DevOps monitoring tool stand out is its availability of powerful communication and collaboration tools. These tools ensure that everyone on your DevOps team is aware of potential issues and works in collaboration.
Here are Datadog key features:
To ensure the success of your DevOps initiatives, you should constantly monitor a few key metrics like Deployment Frequency, Change Lead Time, Change Failure Rate, and Mean Time to Recovery.
Let’s discuss these key metrics in detail now:
There are various factors to consider when choosing the best tools for continuous monitoring in DevOps, such as:
DevOps monitoring tools are an excellent help for your business as they promote collaboration between your development and operation teams. If you are looking for highly qualified and skilled DevOps engineers to take care of your cloud applications and systems, Hicron Software House is here to help. Our DevOps Maturity Assessment and engineers ensure your company’s success by optimizing application or software delivery and fixing bugs quickly. We also make sure your organization is compliant with all security regulations and standards. See our DevOps consulting service and don’t hesitate to contact us today and pave the way for high efficiency and minimum downtime!
After carefully evaluating suppliers, we decided to try a new approach and start working with a near-shore software house. Cooperation with Hicron Software House was something different, and it turned out to be a great success that brought added value to our company.
With HICRON’s creative ideas and fresh perspective, we reached a new level of our core platform and achieved our business goals.
Many thanks for what you did so far; we are looking forward to more in future!
Hicron is a partner who has provided excellent software development services. Their talented software engineers have a strong focus on collaboration and quality. They have helped us in achieving our goals across our cloud platforms at a good pace, without compromising on the quality of our services. Our partnership is professional and solution-focused!
The IT system supporting the work of retail outlets is the foundation of our business. The ability to optimize and adapt it to the needs of all entities in the PSA Group is of strategic importance and we consider it a step into the future. This project is a huge challenge: not only for us in terms of organization, but also for our partners – including Hicron – in terms of adapting the system to the needs and business models of PSA. Cooperation with Hicron consultants, taking into account their competences in the field of programming and processes specific to the automotive sector, gave us many reasons to be satisfied.
