February 02
10 min


DevOps methodology has brought positive results to countless organizations, changing the way software is developed, tested, and deployed. According to the Atlassian survey, 99% of respondents reported that DevOps has positively impacted their organization, with 49% noting improvements in deployment frequency.
However, successful DevOps implementation is not the end of the journey; continuous monitoring is required to ensure optimal performance and efficiency, and DevOps metrics play a crucial role in this process.
This article is your ultimate guide to DevOps metrics, their importance, and potential challenges you may face.
DORA (DevOps Research and Assessment) or DevOps metrics are indicators used to evaluate the effectiveness of DevOps teams (operations and development).
They are a great help in identifying your software’s deployment time, stability, and areas for improvement. The purpose is to optimize organizational processes, meet end customers’ demands, and boost overall business success.
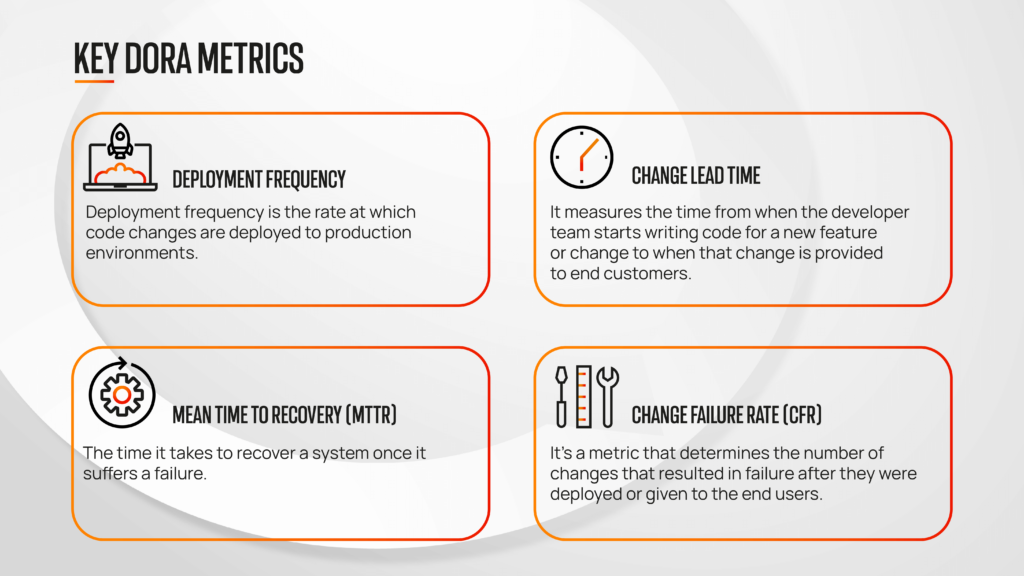
While DevOps performance is measured through various metrics, tracking those 4 key metrics of DORA is essential:
Let’s now discuss these metrics in detail.
Deployment frequency is the rate at which code changes are deployed to production environments. Typically, this production environment refers to your end users who are benefitting from your services. DevOps teams try to quickly deploy new software or applications so customers benefit from new features, increasing your retention rate and customer satisfaction.
However, the deployment frequency can vary across industries, with high-performing teams deploying within a week. On the other hand, organizations with low-performing teams take anywhere from one month to six months for deployments. Let’s understand it better:
Deployment frequency can easily be calculated by dividing the total number of deployments made in a given period by the total number of days in that specific period.
Example:
For instance, if there were 20 deployments made in a month (30 days), the calculation would be:
Deployment Frequency = 20 deployments / 30 days = 0.67 deployments per day.
Here are a few tips that help you improve the deployment frequency rate:
The next JIRA DORA metric is change lead time. It measures the time from when the developer team starts writing code for a new feature or change to when that change is provided to end customers.
By understanding the individual and overall stage change lead time, DevOps teams can get to know where their time is being spent the most. This enables teams to improve and speed up their deployment process, so end users can access new features as quickly as possible.
Let’s take a look at the change lead times for different teams:
You can easily calculate the change lead time by subtracting the order request date from the order delivery date.
Example:
For instance, if your DevOps teams got a request for a software change on 2nd March and they have to submit it by 5th March, the change lead time will be:
Lead Time = 7 – 2 = 5
So, in this case, your change lead time is 5 days, which is common in high-performing teams.
The following tips are helpful in improving your DevOps lead time:
Another one of the four key metrics in DevOps change is the failure rate. It’s a metric that determines the number of changes that resulted in failure after they were deployed or given to the end users. It’s measured in percentage, and as per the 2022 Accelerate State DevOps, even elite-performing teams have a change failure rate of 0% to 15%. Here’s an overview of different teams and their failure rate:
DevOps teams always try to introduce high-quality changes in the existing software. However, incidents can happen anytime, requiring hotfixes or rollbacks. In some cases, a high CFR rate can significantly contribute to an organization’s financial and operational losses.
A recent report states that the total Cost of Poor Software Quality in the US was around $2.08 trillion in 2020. The major contributor to CPSQ is software failures, which total around $1.56 trillion. Therefore, to avoid such losses, it’s important to monitor your DevOps change failure rate and make efforts to improve it.
The change failure rate is the ratio of incidents or failures to the number of deployments.
Example:
For instance, let’s suppose your software suffered 33 failures and you did 100 deployments, your CFR will be:
CFR = 33/100 =33%
Let’s discuss a few tips that can help you improve your CFR rate:
The last key DevOps metric is the mean time to recovery, which is the time it takes to recover a system once it suffers a failure. Occasional hiccups and failures are unavoidable; however, your DevOps teams should be able to recover the system quickly. This reduces downtime, improves customer satisfaction, and gives your teams more time to focus on innovation.
Here’s an overview of the MTTR of different DevOps teams:
It’s calculated by adding the time duration of each downtime and then dividing it by the number of incidents.
Example:
Let’s suppose your website faced some technical glitch and was out of service for 10 hours over the course of a month. This incident happened at least 4 times in a month, so the MTTR is given as follows:
MTTR= 10 hours/5 Times
MTTR= 2 hours per downtime
The following are some tips that improve the MTTR:
Reliability metrics DevOps are indicators that aid in measuring the performance of a system as well as help you figure out areas for improvement. Integrating system monitoring tools and reliability metrics in your business model is mandatory to ensure product success. The most important reliability DevOps metrics are:
Software reliability or system uptime metrics are useful during product development to find out the quality and performance of software at any given time. Here are the reasons why organizations are using reliability metrics DevOps:
Feedback loops are generally useful for describing the relationship between the deployment and operational teams. Each feedback loop consists of different phases, each connected to the other.
This connection means if there’s a change in one phase, it’ll automatically result in a change in the next phase, eventually leading back to the start and making a loop.
Let’s look at the importance of feedback loops for DevOps teams:
Firstly, feedback loops are useful in bridging the gap between software function and customer expectations. How? Well, the infinity feedback loops constantly keep track of how customers engage with your software, feeding this data back to developers. This aids DevOps teams in creating solutions based and optimized on what customers want, resulting in higher customer satisfaction.
In both reinforcing and infinity performance feedback loops, the software moves through different phases throughout the DevOps pipeline and is constantly monitored. This advanced monitoring allows you to pinpoint issues early on and get bug reports, reducing the chances of downtime.
DevOps flow moves in a linear direction even when one phase is changed into another, and this means your project will also flow and develop in one direction. This makes it easy for your DevOps teams to manage tasks, promoting collaboration and increasing overall efficiency.
There are various challenges that make it difficult for you to track DevOps metrics and impact overall organizational success. Some common ones in this regard are:
The first thing you can do is promote cross-functional collaboration so the DevOps teams can work together closely. This allows them to share knowledge, identify issues earlier, and collectively improve DevOps processes, breaking down data silos.
There’s not one DevOps metric to measure. Instead, you’ve to measure the 4 primary metrics in DevOps, such as Mean Time to Recovery, Change Lead Time, Change Failure Rate, and Deployment Frequency, to gather information about team performance fully.
Make sure to continuously monitor these DevOps metrics throughout the software lifecycle, from production to integration and release. Why? Doing so will pinpoint areas where there are chances of incidents or failures and encourage data-driven decision-making.
Most of all, you should invest in high-quality analytics platforms that gather, analyze, and visualize data from various software lifecycle stages. Look for tools that have robust integration capabilities and top-notch automation features and maintain effective communication.
DevOps metrics are a great help in tracking your DevOps teams’ performance and ensuring your company is on the path to success. However, if you cannot monitor key DevOps metrics and other aspects, contact Hicron Software House. We have a team of highly qualified DevOps engineers who carefully analyze each aspect of your DevOps lifecycle, optimizing it per user feedback for an incredible customer experience. Get in touch with us today to take the efficiency of your DevOps teams to the next level!
Hicron’s contributions have been vital in making our product ready for commercialization. Their commitment to excellence, innovative solutions, and flexible approach were key factors in our successful collaboration.
I wholeheartedly recommend Hicron to any organization seeking a strategic long-term partnership, reliable and skilled partner for their technological needs.

After carefully evaluating suppliers, we decided to try a new approach and start working with a near-shore software house. Cooperation with Hicron Software House was something different, and it turned out to be a great success that brought added value to our company.
With HICRON’s creative ideas and fresh perspective, we reached a new level of our core platform and achieved our business goals.
Many thanks for what you did so far; we are looking forward to more in future!
Hicron is a partner who has provided excellent software development services. Their talented software engineers have a strong focus on collaboration and quality. They have helped us in achieving our goals across our cloud platforms at a good pace, without compromising on the quality of our services. Our partnership is professional and solution-focused!
The IT system supporting the work of retail outlets is the foundation of our business. The ability to optimize and adapt it to the needs of all entities in the PSA Group is of strategic importance and we consider it a step into the future. This project is a huge challenge: not only for us in terms of organization, but also for our partners – including Hicron – in terms of adapting the system to the needs and business models of PSA. Cooperation with Hicron consultants, taking into account their competences in the field of programming and processes specific to the automotive sector, gave us many reasons to be satisfied.
