February 05
7 min


Businesses are quickly adopting DevOps to streamline their development and deployment processes, aiming for faster delivery, improved collaboration, and enhanced agility. However, many DevOps initiatives don’t reach their full potential or fail, and one of the major culprits behind this is a lack of observability. Companies find it difficult to monitor, analyze, and optimize the entire software delivery pipeline, leading to lags and failure.
In this article, we are going to discuss DevOps observability, its benefits, and best practices. Let’s begin.
DevOps observability refers to the process of gaining insights into the internal state of a system or software based on external outputs. If an organization has high DevOps observability, this means it efficiently analyzes its system’s performance. It makes quick decisions to eliminate the root cause of the issue without getting into the hassle of testing and coding the software again.
About 74% of organizations have adopted DevOps in some form. If you are one of them, you should perform DevOps observability to understand your system performance better and improve the business’s overall output. Here are the main benefits of DevOps observability:
Helps Gain a Deeper Understanding of the System
Firstly, DevOps observability allows your IT teams to gain a deeper understanding of system performance. You can view how different parts of an application are working together and the possibility of errors. This lets IT professionals make informed decisions that improve systems reliability.
Quickly Identify and Fix the Problem
DevOps observability tools help you track key metrics and detect system anomalies. They identify the root cause of a problem and provide detailed, real-time insights into system health. You can then use this information to troubleshoot the issue, minimizing the overall Mean Time to Recovery (MTTR) rate.
Contributes to Business Success
Another benefit of DevOps observability is that it contributes to business success. How? Well, it aids you in making sure that your applications and infrastructure are operating optimally. Customers experience minimum downtime and outages which leads to greater customer satisfaction and retention, ultimately boosting business revenue.
Many people often confuse DevOps observability with DevOps monitoring, but they are two different terms. Let’s discuss the major differences between both and how they are important for DevOps success:
Error Detection
Monitoring provides you information about whether there’s an error in the system utilizing preset metrics and log database. It’s a great help in finding predetermined errors in the system.
DevOps observability, on the other hand, processes the information provided by the monitoring tools and works to determine what caused a system’s problem.
To make it simple, monitoring focuses on “What,” such as what the issues are in a system or application. DevOps observability is the “Why”, and it identifies why there’s an issue in the system.
Methodology
The methodology used for monitoring and observability is also quite different. In monitoring, you focus on setting up specific KPIs that need to be tracked. This makes it a single-plane approach, as it only notifies when there’s an issue, and you still cannot find the origin of the problem.
Contrarily, observability focuses on informing you about issues before they occur and also makes it easy for you to understand the core reason for it. Hence, observability is a traversable map.
Both monitoring and observability go hand in hand and help DevOps teams find and eliminate issues in a system before they result in downtime. For instance, monitoring tools and KPIs alert the DevOps teams about any potential issue in the system, such as high CPU usage or increased error rates. Observability tools use this data to identify and analyze the reason behind high CPU usage and how to solve it.
Traditionally, observability is defined by three fundamental elements—metrics, distributed traces, and logs, often referred to as the “three pillars of observability.”
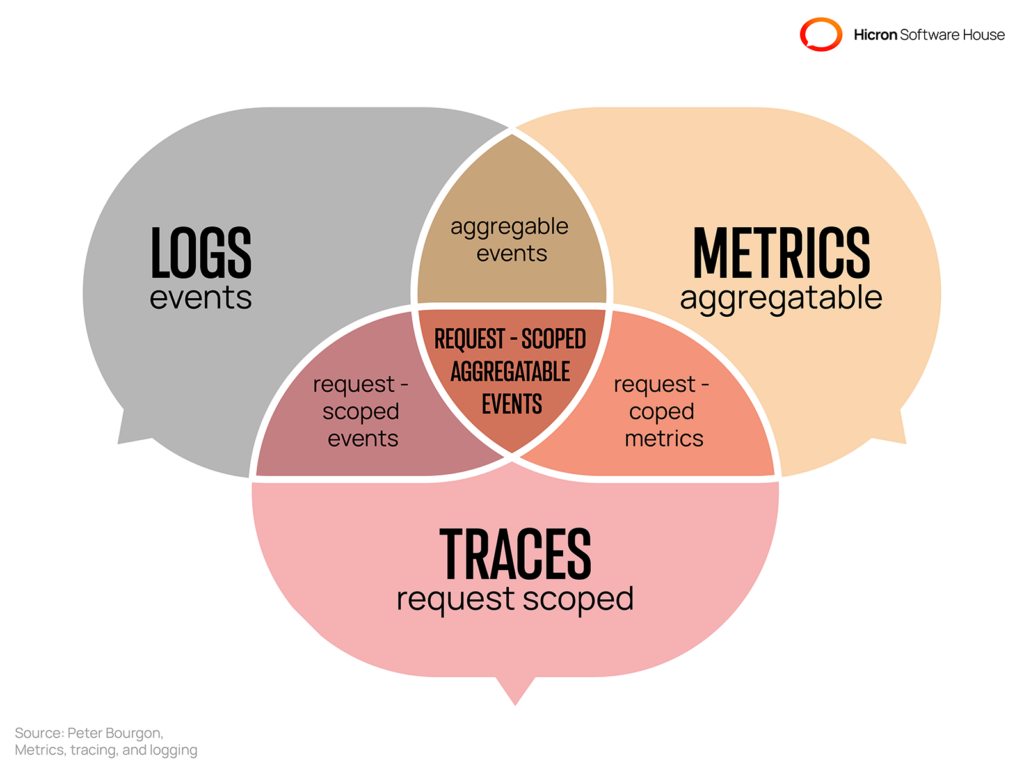
Now, let’s discuss these three pillars in detail.
Metrics are key performance indicators that tell you about the health of a system and pave the way for informed decision-making. The many types of metrics used in DevOps observability are:
The next pillar of DevOps observability is a trace. These refer to the series of actions that a user performs on your server or application. Distributed tracing is an important method in this regard, as it observes traces or requests moving within a system. For instance, it allows DevOps teams to trace specific requests by giving them a unique ID so they can get information about the trace behavior within a system.
Logs are typically the record of events generated by a system. They aid you in resolving an issue by providing you with a chronological series of events to ensure you properly understand what really happened in the system. In software development, you’ll come across different types of logs, such as:
Application Logs
Application logs are specific to different applications, such as databases, web server applications, and other in-house apps. These logs identify and correct application performance and security issues by offering insights into performance metrics and error messages.
Server Logs
Server logs, as the name suggests, keep track of the actions of a server operating system. These logs provide information about who visited your server and help identify cybersecurity issues, spider traps, spam content dumped by hackers, incorrect server responses, and broken external links
Error Logs
It’s a file that tracks a single or multiple errors that occur while running an application or server. It parses and pinpoints critical errors, shows historical trends of similar errors, and notifies DevOps teams about security-related incidents.
Now that you are aware of DevOps observability and its benefits, you must create a strong strategy to implement it. Below are the key factors businesses should consider when developing a thorough observability strategy.
First things first, you should start by clearly defining your key performance indicators. These can be anything from system response time to error rates to resource utilization, such as CPU usage. Having clear KPIs makes it easy for you to understand the concept of a normal system and helps you spot system anomalies.
The most important aspect of observability implementation is choosing the right platform. You should make sure the platform you pick fulfills your needs and has features like scalability, performance, and a low learning curve. It should also be within your budget to avoid any financial strain on your business.
However, if finding the right observability platform feels like a hassle, you should contact Hicron Software House. We have a team of DevOps professionals and IT experts who guide you in your observability efforts and take care of your IT applications and systems.
Did you know that telemetry data like logs, metrics, and traces are totally different from each other? This necessitates you to opt for observability tools that can analyze telemetry data and provide actionable insights through data visualization.
They should make it easy for you to find each application’s log or record and must be able to efficiently track key metrics to research and resolve a performance issue quickly.
Now that we’ve covered observability and its significance, let’s explore 4 best practices in observability that every DevOps engineer should adopt
Start by clearly defining objectives and benchmarks for your observability efforts. Identify what you want to achieve, such as improving system reliability or reducing mean time to recovery. Setting these goals is useful in tracking progress and motivates everyone to work toward a common goal.
Monitor various aspects of your system’s performance, including infrastructure, applications, and user experience. You can combine monitoring tools with observability tools to learn your response time and error rates.
You should also foster smooth communication and collaboration with DevOps members involved in observability efforts. For instance, you can create channels for sharing insights, discussing various system issues, and coordinating actions. This enables quick decision-making and problem-solving.
It’s essential to inform all stakeholders, such as management, development teams, and other relevant parties, about your observability efforts and significant findings. This can be done by providing them with regular updates via reports, dashboards, or meetings.
A DevOps observability solution is a must-do thing to ensure the success of your DevOps initiatives. To achieve maximum results from your observability efforts, you should combine them with monitoring tools and have an in-depth understanding of your system’s performance.
To take your company’s success to the next level, contact Hicron Software House. We manage your applications throughout their lifecycle to ensure your business is at the top of customers’ minds. Partnering with us means you can bid farewell to downtime and experience faster issue resolution.
Hicron’s contributions have been vital in making our product ready for commercialization. Their commitment to excellence, innovative solutions, and flexible approach were key factors in our successful collaboration.
I wholeheartedly recommend Hicron to any organization seeking a strategic long-term partnership, reliable and skilled partner for their technological needs.

After carefully evaluating suppliers, we decided to try a new approach and start working with a near-shore software house. Cooperation with Hicron Software House was something different, and it turned out to be a great success that brought added value to our company.
With HICRON’s creative ideas and fresh perspective, we reached a new level of our core platform and achieved our business goals.
Many thanks for what you did so far; we are looking forward to more in future!
Hicron is a partner who has provided excellent software development services. Their talented software engineers have a strong focus on collaboration and quality. They have helped us in achieving our goals across our cloud platforms at a good pace, without compromising on the quality of our services. Our partnership is professional and solution-focused!
The IT system supporting the work of retail outlets is the foundation of our business. The ability to optimize and adapt it to the needs of all entities in the PSA Group is of strategic importance and we consider it a step into the future. This project is a huge challenge: not only for us in terms of organization, but also for our partners – including Hicron – in terms of adapting the system to the needs and business models of PSA. Cooperation with Hicron consultants, taking into account their competences in the field of programming and processes specific to the automotive sector, gave us many reasons to be satisfied.
